Bitcoin Next Steps?

If you follow Henrik Zeberg he you’ll notice that he is putting in claims that Bitcoin will hit 130-140,000$ before collapsing to sub 10,000$.
If you follow Raoul Pal, he believes Bitcoin is on the road to 230,000$
If you follow Dr Michael Howell, he believes Bitcoin is going to be range bound, and for every 1 standard deviation to trend you should on pull backs add to your stack.
In September 2024 I started advising our partners it would be prudent to de-risk towards the end of the year due to the decline in Liquidity, specifically the US side of YCC-not-YCC and QE-not-QE being drained (~6T$), we see similar in Global Liquidity Market(s) in June 2025, and in September 2025, actually in December 2025 liquidity commenced a up-trace however momentum is low…

Then we come to the Parabolic Supports which you can see below, here, if there’s a lack of bar(s) greenish then its a weak move, i.e the conditions liquidity impulse wise are just not there.

It should be noted Impulse Wave(s) of liquidity provide subject to localized/macro conditions overall, the firepower for Bitcoin to rip, though Bitcoin is at the bottom of its wave and looks are up, its still in a declining trend
If we look at the SMB Impact (Shadow Monetary Base) impact chart → note Dr Michael Howell will be providing data back to 2010 in the near term, so this should enable us to run this backwards through time, provides a band (squeezing) but with a top ratios of around 100,000$.

Likewise if we see the Power Law chart below which historically has been the most accurate provisioner of intelligence on what part of the cycle we are in, we are firmly within the decline with about 75% of the move achieved (to a bottoming zone) — i.e closer to the bottom than the top.

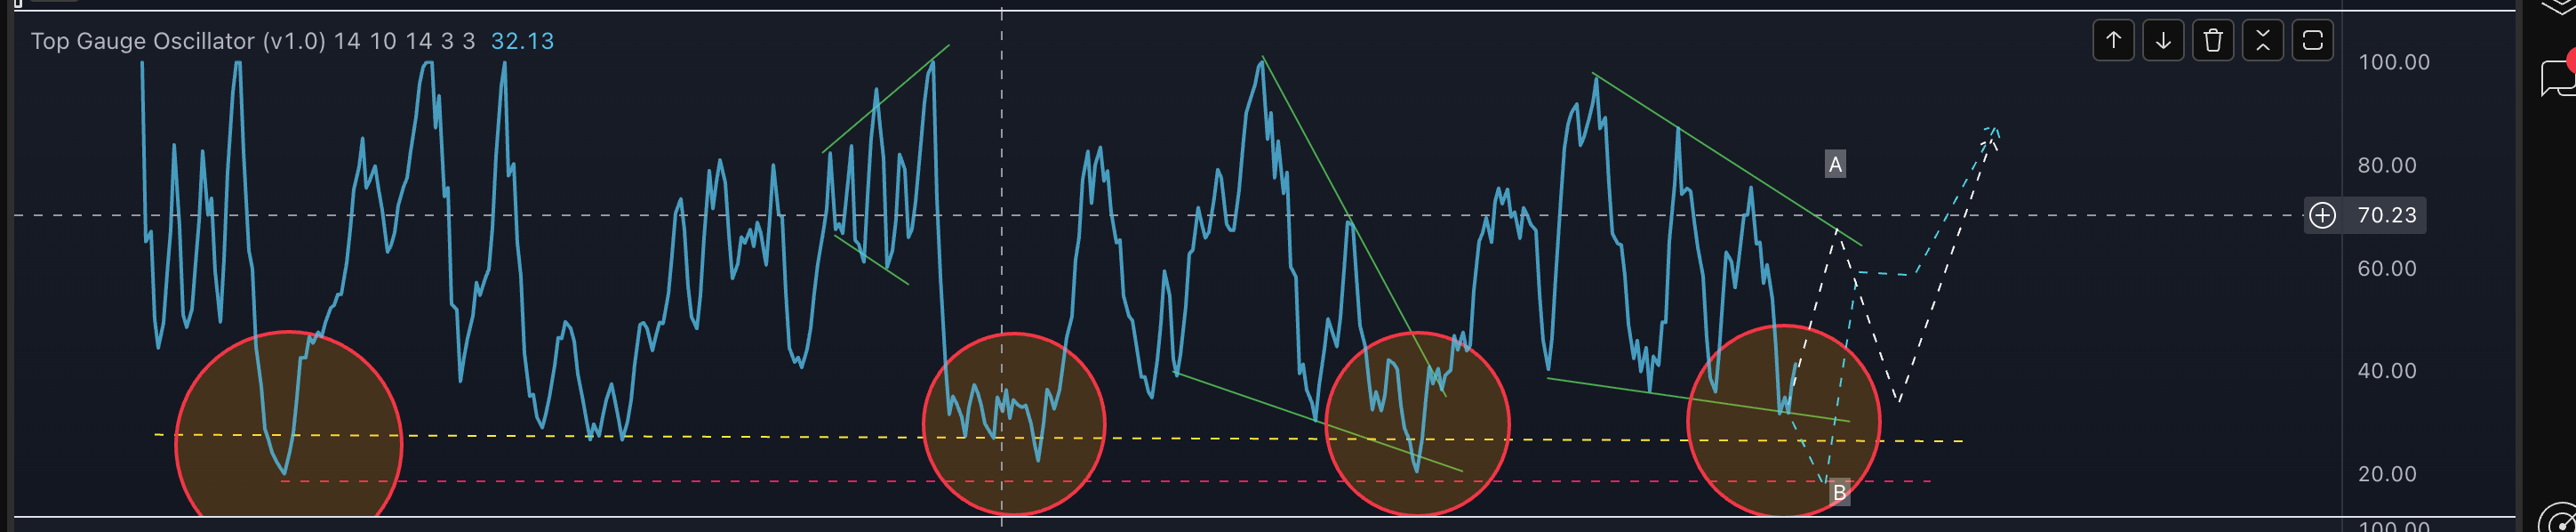
Which brings me to the following, my top/bottom oscillator chart, the following move in the oscillator leads to around 99,000$
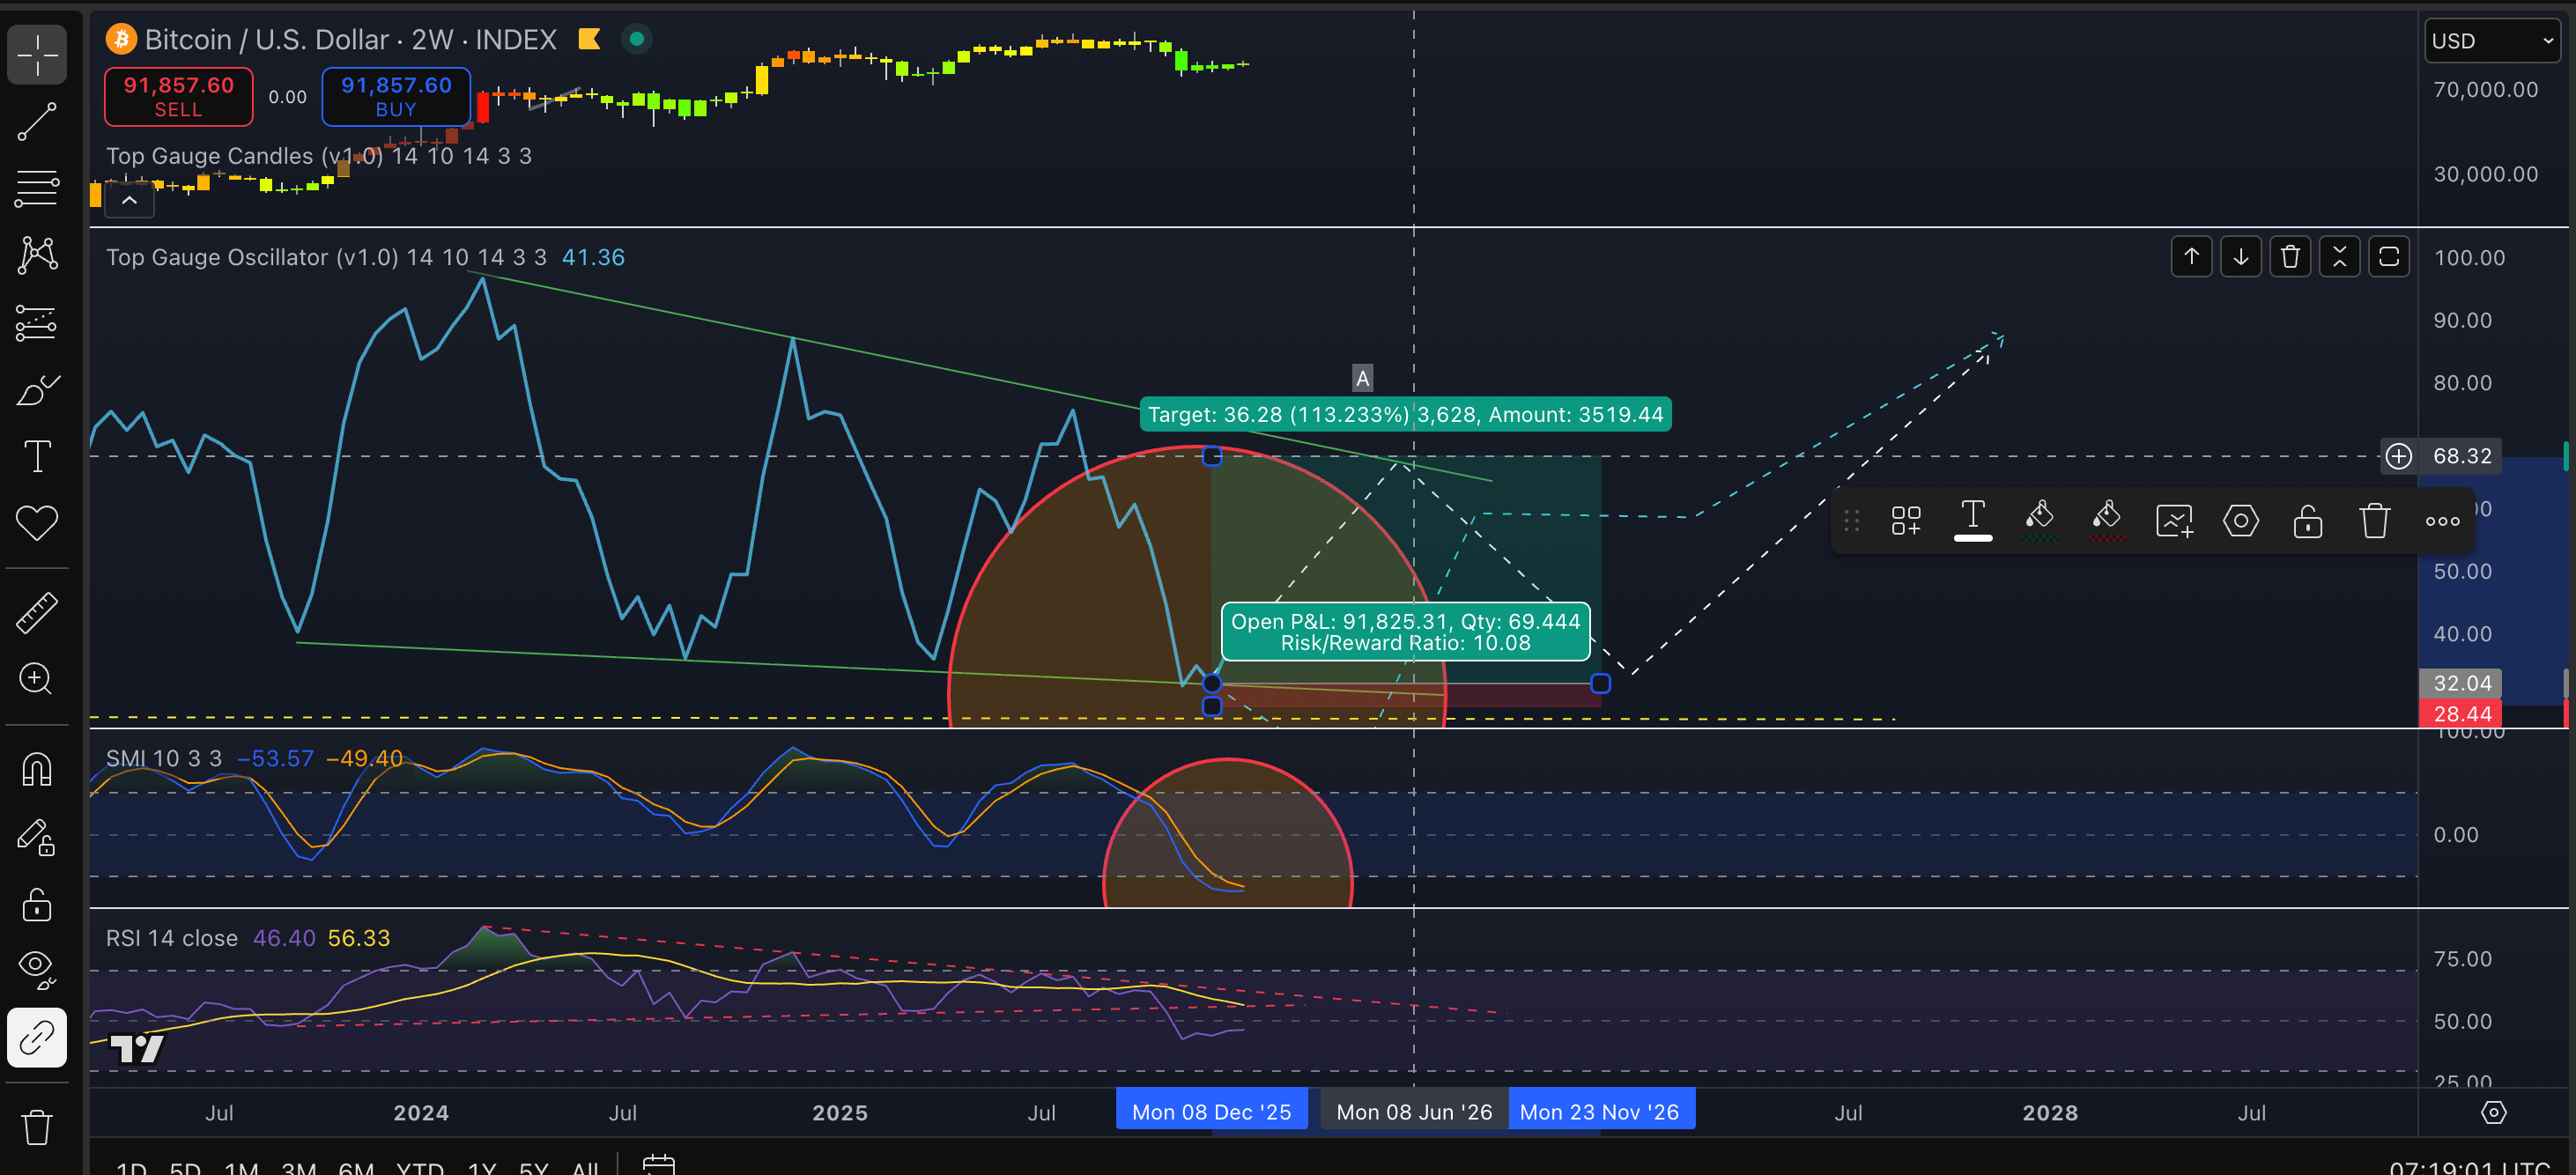
Typically this would signal as a better view —> 99,000$ before a new marginal low, followed to a new high…
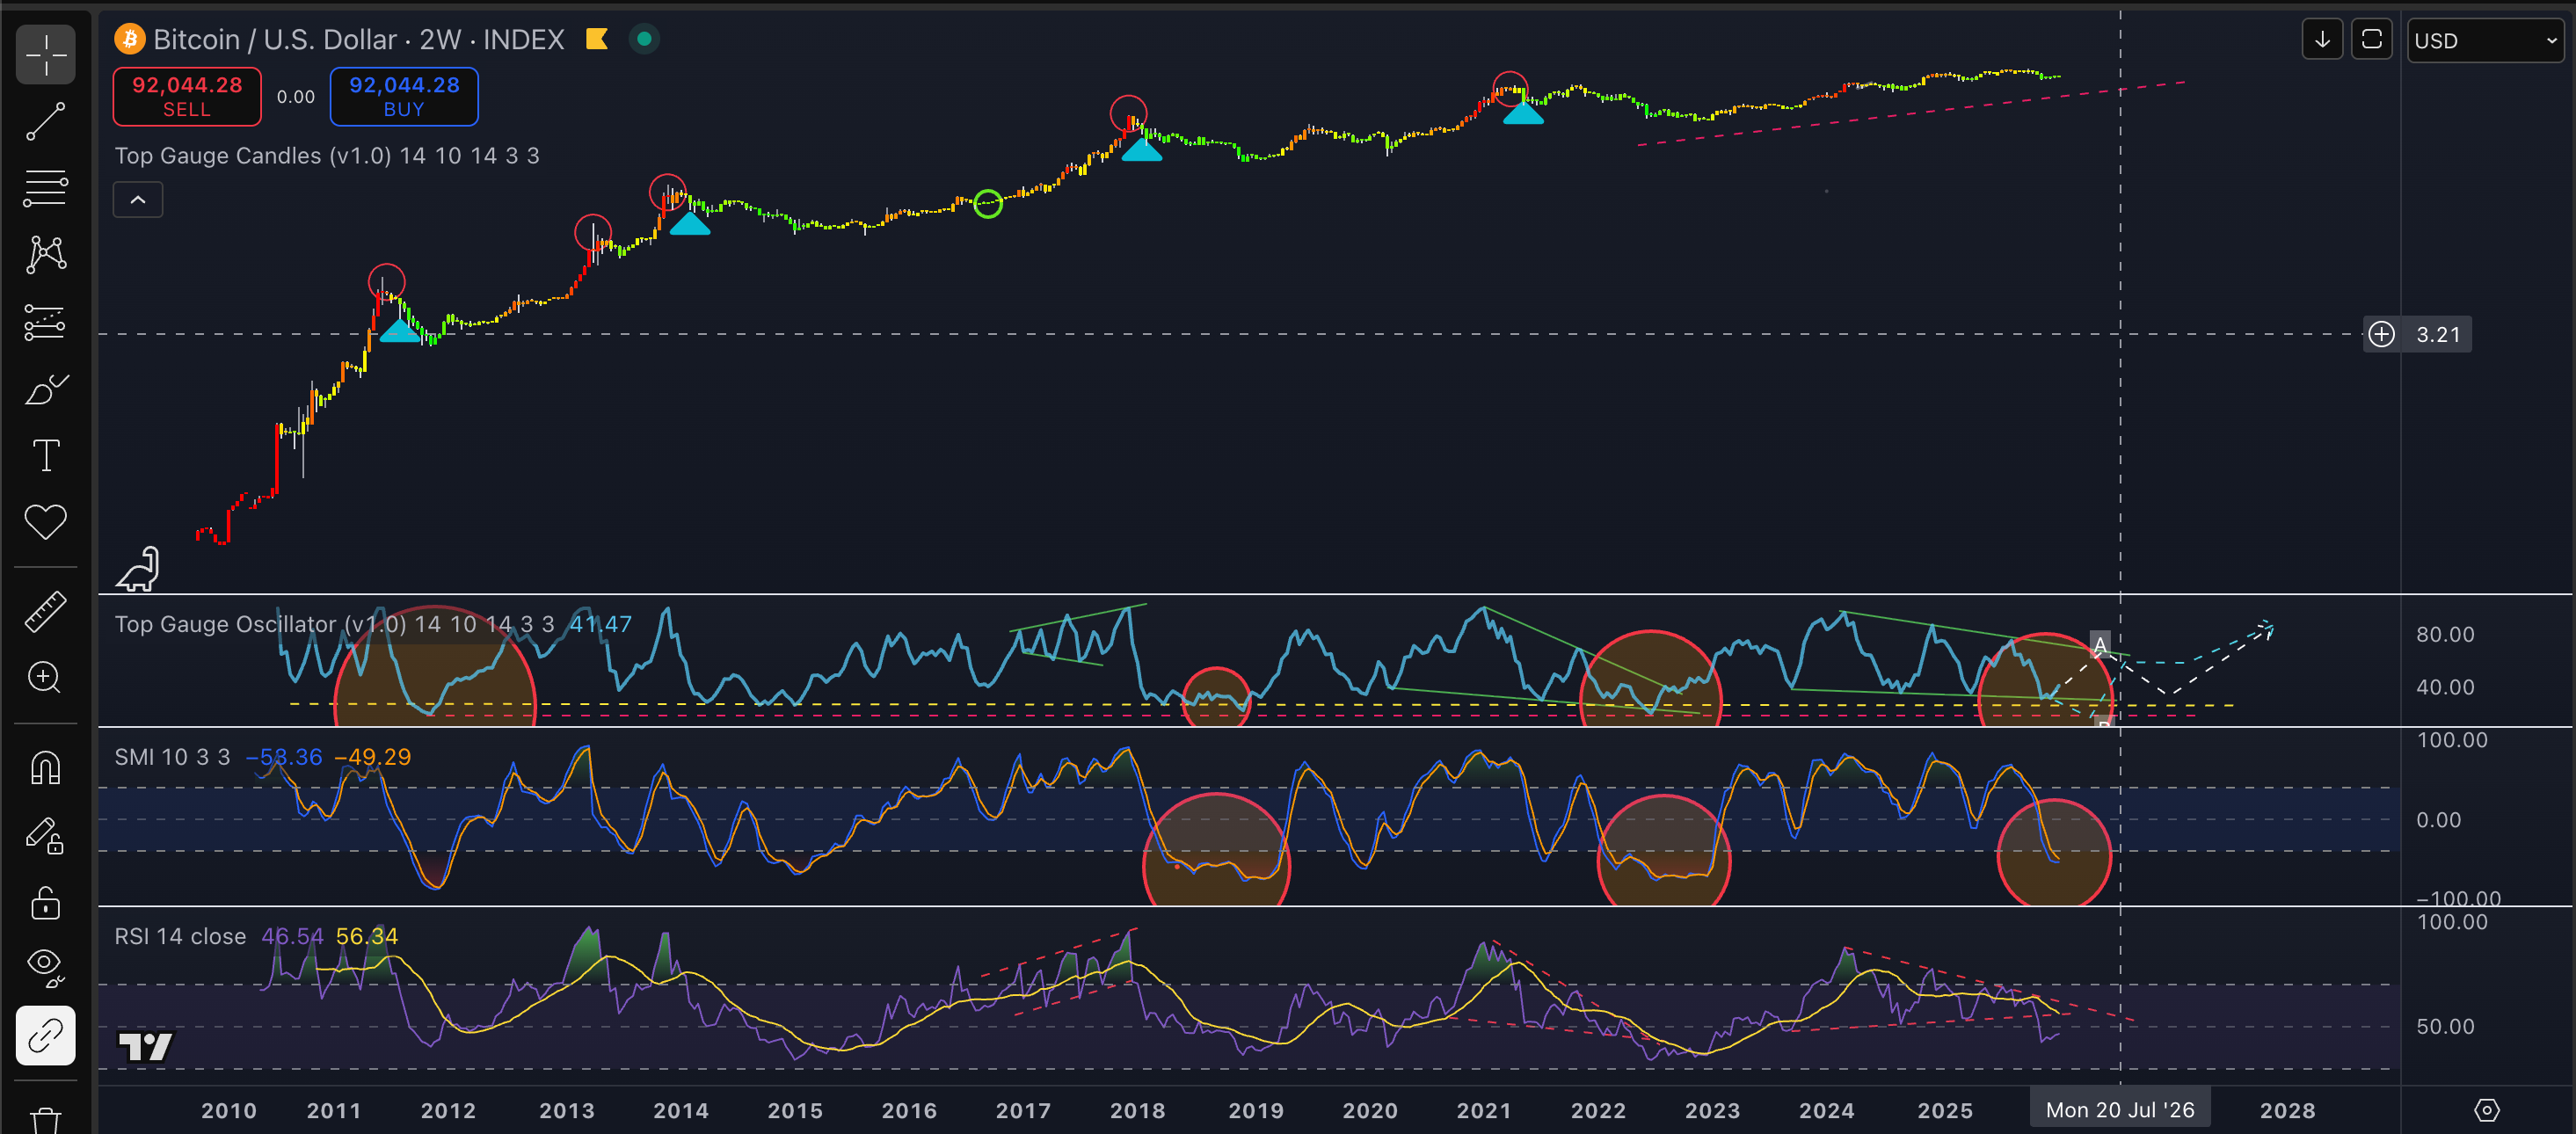
Overall chart.
Which brings me to the following chart which would align… though the price levels are not certain for their corrective to ~Z → my gut at least feels a road map similar to this will play-out based on liquidity and the power-law structure breakdown.
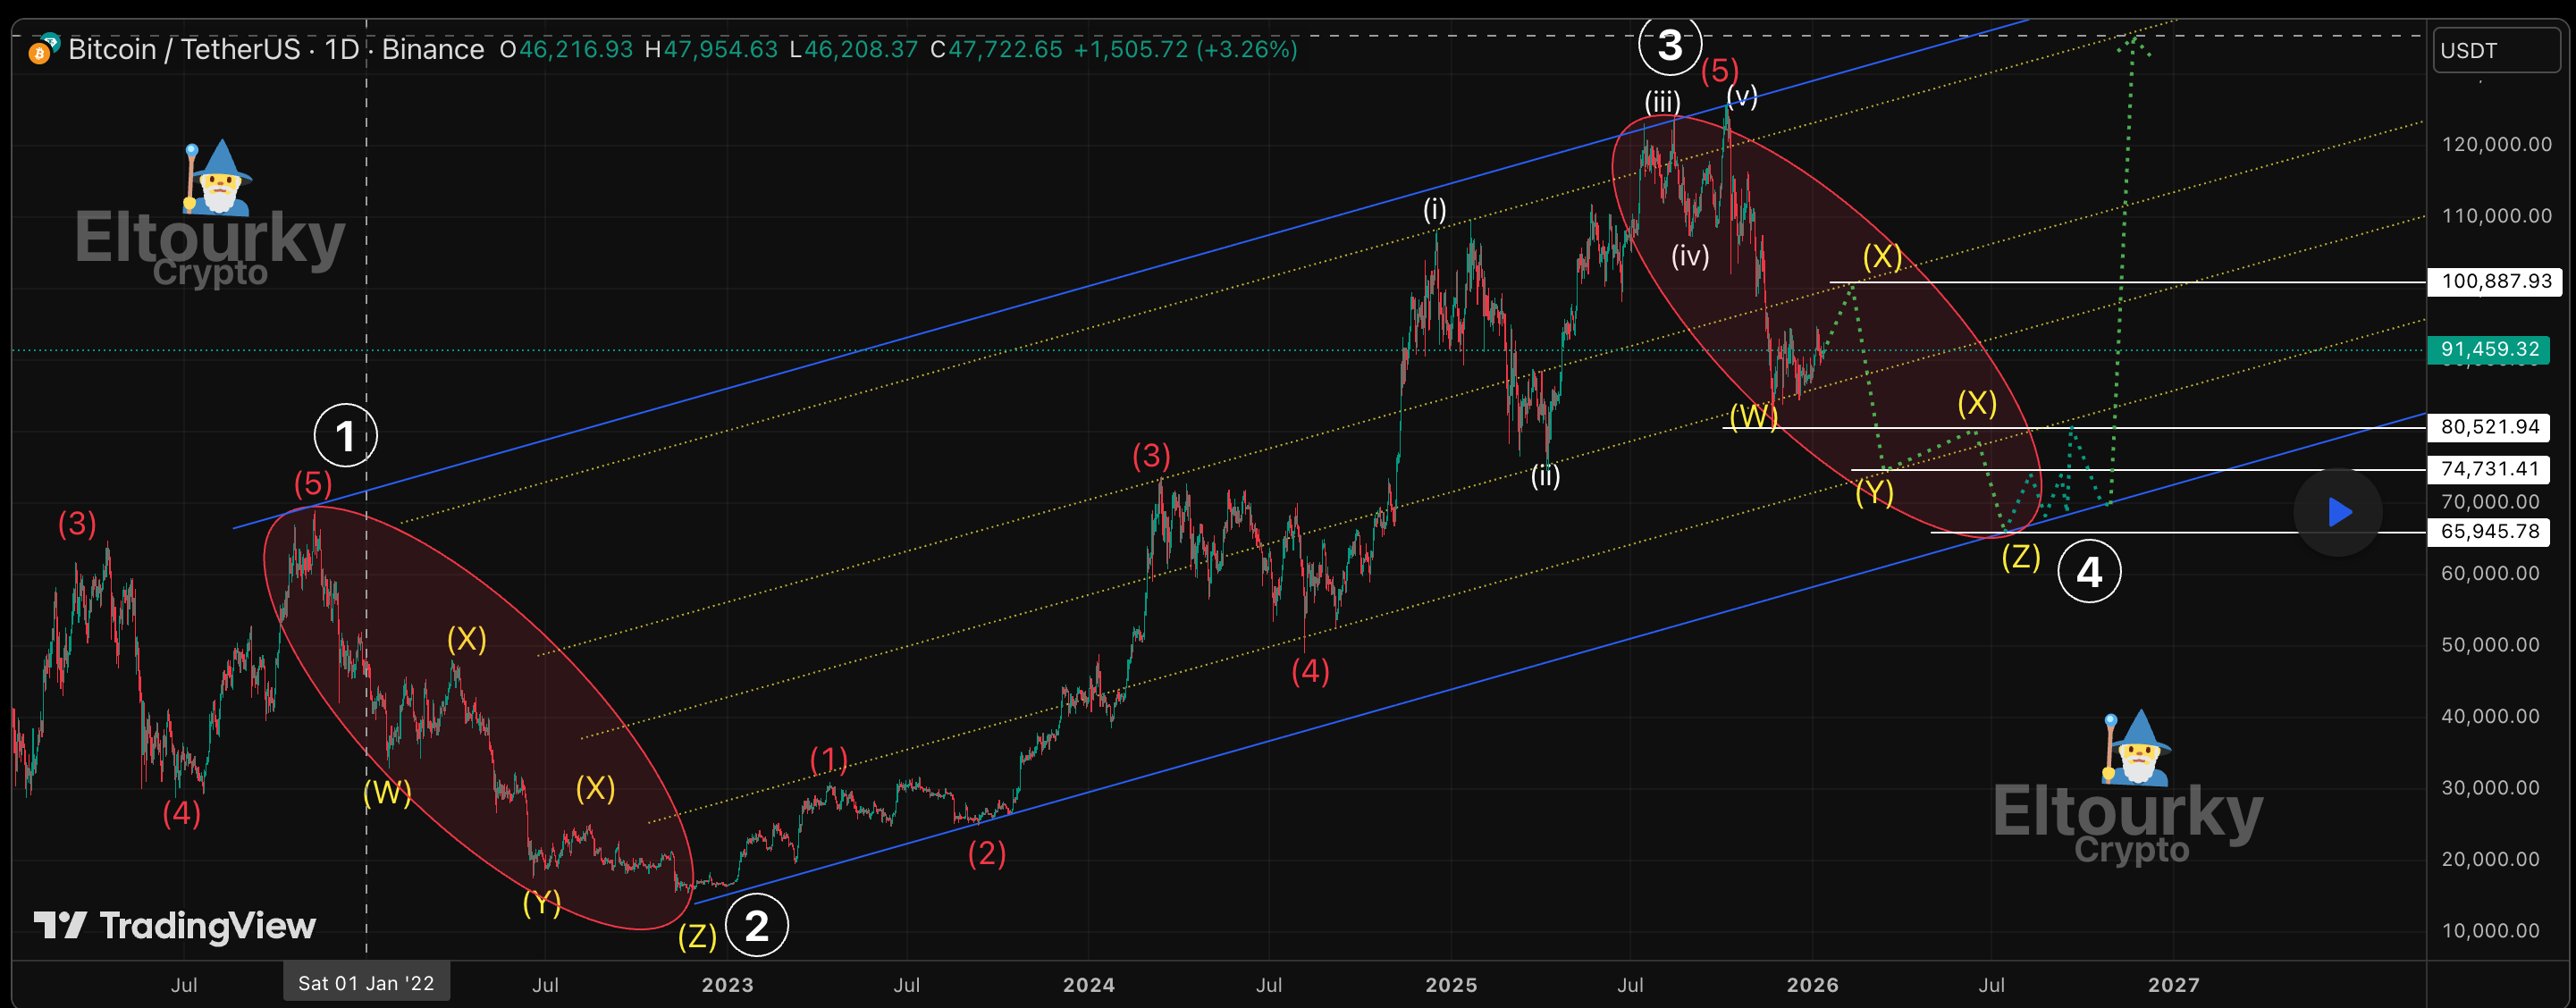
However with Trumps DOJ now going after Powell, things could change fast…
Something to be aware of, the Liquidity Wave points to a bottom and a run up but in a downtrend, momentum is declining, power-law is closer to the bottom than the top, Shadow-Monetary-Base points to a squeezing zone being created with a top around 100,000$ in the current run, and the Top/Bottom Oscillator points to 99,000$ before a resumed downtrend before a uptrend…