


Just glancing through some of the trackers... Global Liquidity is down (roughly 1.5% so expected/ing BTC to decline (from its peak) 22.5% = 85,250 (approx. - give or take 10k) = dependent on various other factors such as Shadow Monetary Base is holding up better, but MOVE index is now moving up (Iran et al). which impacts Collateral Multipliers (haircuts) which in return impacts liquidity, thus BTC.

Charts
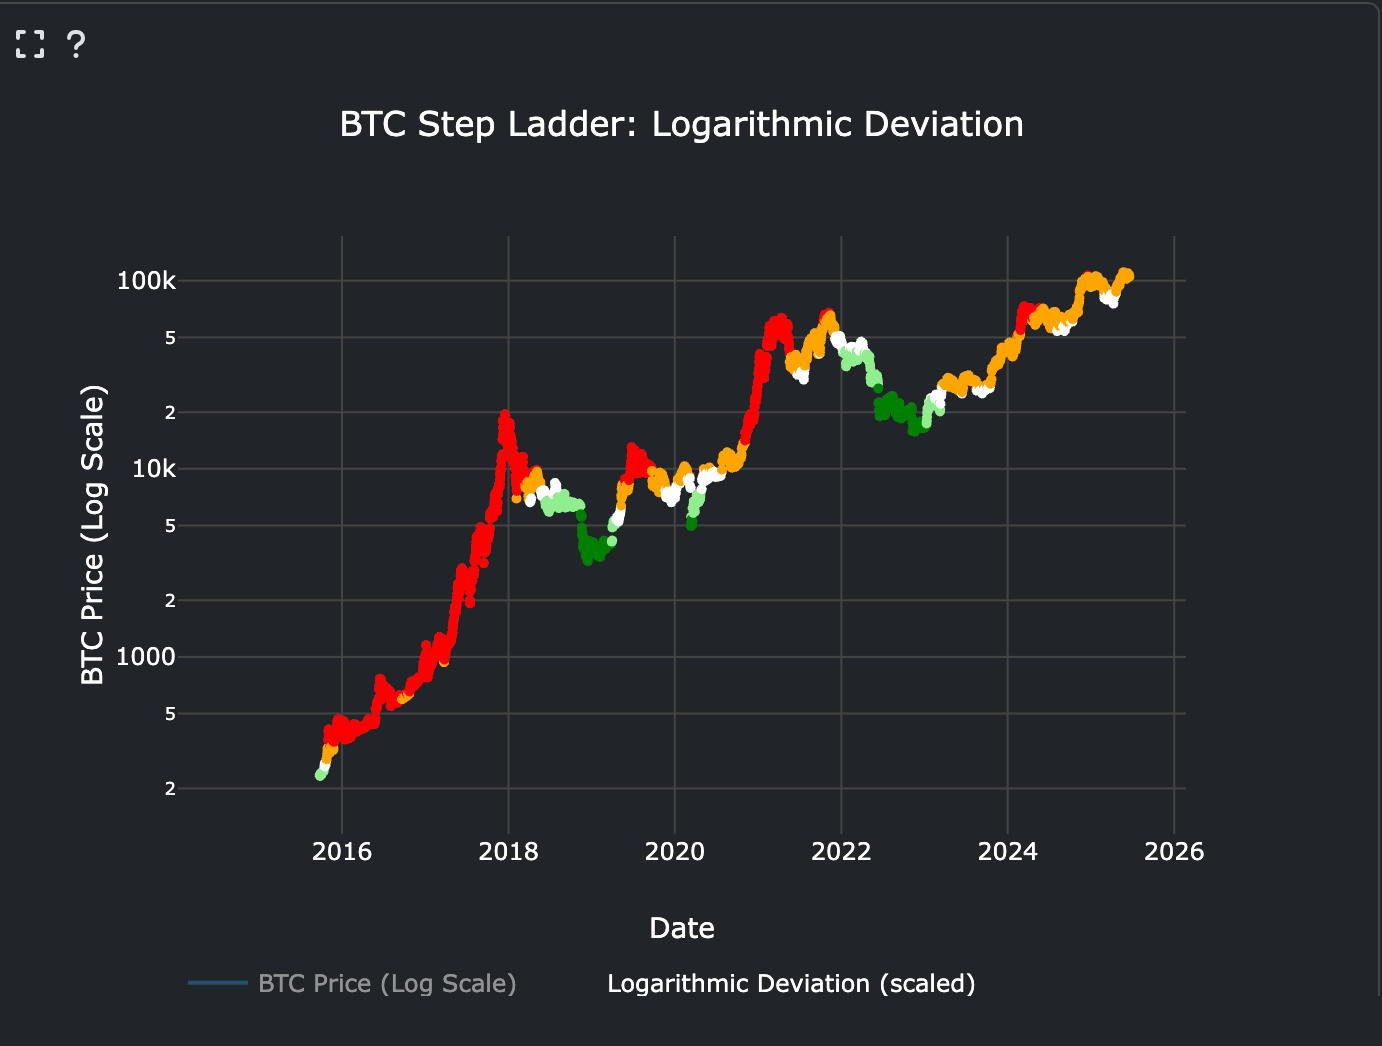
Past Performance: Over the past week, the chart shows mixed signals with both positive and negative deviations, suggesting a period of consolidation or indecision in the market. The past month reveals more pronounced negative deviations, indicating a potential downtrend or correction phase. Looking at the past quarter, there are instances of significant positive deviations followed by sharp corrections, highlighting the volatile nature of Bitcoin and the importance of monitoring these deviations for trend confirmation or reversal signals.
Forward Outlook: For the next week, if the deviations continue to hover around the neutral zone (white), it may suggest a continuation of the current consolidation phase. A breakout with sustained positive deviations (orange or red) could indicate a bullish momentum, while persistent negative deviations (light green or green) might signal further downside. Over the next month, monitoring the frequency and magnitude of deviations will be key to identifying any emerging trends. For the next quarter, historical patterns suggest that prolonged periods of negative deviations may eventually lead to a buying opportunity, while extended positive deviations could precede a correction. Investors should remain vigilant and consider these deviations alongside other market indicators for a comprehensive outlook.
The chart titled 'BTC Log Deviation Trends' illustrates Bitcoin's price movements on a logarithmic scale alongside a color-coded representation of logarithmic deviations from a presumed trend or benchmark. The deviations are scaled and marked with colors indicating the magnitude and direction of the deviation—red for significantly positive, orange for moderately positive, white for neutral, light green for moderately negative, and green for significantly negative. This visualization helps in identifying periods where Bitcoin's price deviates substantially from its expected trajectory, which can signal overbought or oversold conditions, potential reversals, or continuation patterns. The logarithmic scale is particularly useful for analyzing Bitcoin's long-term price trends, as it normalizes percentage changes over time, making it easier to compare movements across different price levels. Understanding these deviations is crucial for investors and traders as they can provide insights into market sentiment, potential entry or exit points, and the overall health of the Bitcoin market.
Past Performance: Over the past week, the chart shows mixed signals with both positive and negative deviations, suggesting a period of consolidation or indecision in the market. The past month reveals more pronounced negative deviations, indicating a potential downtrend or correction phase. Looking at the past quarter, there are instances of significant positive deviations followed by sharp corrections, highlighting the volatile nature of Bitcoin and the importance of monitoring these deviations for trend confirmation or reversal signals.
Forward Outlook: For the next week, if the deviations continue to hover around the neutral zone (white), it may suggest a continuation of the current consolidation phase. A breakout with sustained positive deviations (orange or red) could indicate a bullish momentum, while persistent negative deviations (light green or green) might signal further downside. Over the next month, monitoring the frequency and magnitude of deviations will be key to identifying any emerging trends. For the next quarter, historical patterns suggest that prolonged periods of negative deviations may eventually lead to a buying opportunity, while extended positive deviations could precede a correction. Investors should remain vigilant and consider these deviations alongside other market indicators for a comprehensive outlook.

MOVE index impacts collateral multiplier (hypothecation) within the Eurodollar Market which impacts liquidity, which in return impacts BTC Significantly.

The chart illustrates the relationship between global liquidity changes (6-week percentage change) and Bitcoin's price movements (6-week percentage change lagged by 13 weeks). It highlights how shifts in liquidity conditions can precede Bitcoin's performance, suggesting a potential causal link. This matters because it provides insights into how macroeconomic liquidity trends may influence cryptocurrency markets, which are often seen as a barometer for risk appetite and liquidity conditions. Understanding this relationship can help investors anticipate market movements and adjust their strategies accordingly.
Past Performance: Over the past week, liquidity changes have shown modest fluctuations, while Bitcoin's lagged performance has been volatile, reflecting the cryptocurrency's sensitivity to broader market conditions. In the last month, liquidity trends have stabilized slightly, coinciding with a period of relative calm in Bitcoin's price movements. Over the past quarter, both liquidity and Bitcoin have experienced significant swings, underscoring the interconnectedness of global liquidity and crypto markets.
Forward Outlook: In the coming week, liquidity conditions are expected to remain stable, which may support a steady Bitcoin performance. Over the next month, any significant changes in central bank policies or global liquidity could lead to heightened volatility in Bitcoin. For the next quarter, if liquidity trends continue to improve, Bitcoin may see upward momentum, though external shocks or policy shifts could disrupt this trajectory.

Internally generated dynamic timing arrays system for BTC.

The chart titled 'Quantum Trend Detector BTC v1' displays the price of Bitcoin (BTC) alongside a proprietary 'Quantum Trend Score' that attempts to identify bullish, bearish, or neutral market conditions. The score oscillates between -1 and 1, with positive values indicating bullish trends and negative values signaling bearish trends. The chart also includes colored markers that visually represent these signals, making it easier to interpret potential turning points in the market. This tool is significant because it provides a quantifiable measure of market sentiment, which can be invaluable for traders and investors looking to time their entries and exits more effectively. The combination of price action and trend score offers a multi-dimensional view of market dynamics, potentially revealing underlying strength or weakness that isn't immediately apparent from price alone.
Past Performance: Over the past week, the Quantum Trend Score has shown increased volatility, with frequent shifts between bullish and bearish signals, suggesting a period of market indecision. The past month has seen a more sustained bullish trend, as indicated by a predominance of green markers and scores consistently above zero, aligning with a notable uptick in BTC price. The quarterly view reveals a mix of bullish and bearish phases, with the trend score successfully capturing major price swings, demonstrating its utility in identifying broader market trends over longer time horizons.
Forward Outlook: For the next week, the Quantum Trend Score's recent volatility suggests that traders should brace for potential short-term fluctuations, with no clear directional bias yet established. Over the next month, if the score stabilizes above zero and maintains a bullish signal, it could indicate a continuation of the upward trend, possibly attracting more buyers into the market. The quarterly outlook remains cautiously optimistic, provided the trend score sustains its positive momentum; however, any prolonged dip into negative territory would warrant a reassessment of bullish assumptions, as it could precede a more significant correction.

The chart titled '3SD - Bands v BTC' illustrates Bitcoin's price movements relative to statistical standard deviation bands (+/-1σ, +/-2σ, +/-3σ) over time. These bands are derived from historical volatility and serve as dynamic support and resistance levels, highlighting periods of overbought or oversold conditions. The heatmap fills between the +/-3σ bands, colored by normalized trading volume, provide additional context on market activity intensity during extreme price movements. This visualization is crucial for identifying potential reversal points and understanding the relationship between volatility, trading volume, and price trends in Bitcoin markets.
Past Performance: Over the past week, Bitcoin's price has shown moderate volatility, oscillating between the +/-1σ bands, indicating relatively stable market conditions. The past month saw prices testing the +/-2σ bands, reflecting increased volatility and potential shifts in market sentiment. Quarterly performance reveals several touches of the +/-3σ bands, suggesting extreme overbought or oversold conditions that often precede significant trend reversals or corrections.
Forward Outlook: In the coming week, if Bitcoin remains within the +/-1σ bands, expect consolidation with limited directional bias. A break above +1σ could signal bullish momentum, while a drop below -1σ may indicate bearish pressure. Over the next month, watch for tests of the +/-2σ bands, which could signal stronger trend developments. Quarterly projections suggest potential volatility spikes touching the +/-3σ bands, offering high-conviction reversal opportunities if accompanied by elevated trading volume.

The chart illustrates the relationship between the Collateral Multiplier, the MOVE Index (a measure of bond market volatility), and Bitcoin (BTC) prices from December 2022 to June 2025. The Collateral Multiplier, which reflects the leverage in the financial system, shows relative stability with minor fluctuations, suggesting controlled risk-taking by financial institutions. The MOVE Index, indicating bond market volatility, exhibits periodic spikes, particularly in early 2023, likely driven by central bank policy shifts and macroeconomic uncertainty. Bitcoin, on the other hand, displays significant volatility and a general upward trend, peaking in mid-2025, highlighting its role as a speculative asset and hedge against traditional financial system risks.
Past Performance: Over the past week, the Collateral Multiplier remained stable at 1.65, while the MOVE Index showed slight volatility, ending at 97.18. Bitcoin prices experienced a minor decline, closing at 105,140.38. In the last month, the Collateral Multiplier saw a marginal decrease from 1.67 to 1.65, the MOVE Index fluctuated between 89.65 and 137.26, and Bitcoin prices ranged from 94,488.44 to 109,035.39. Over the past quarter, the Collateral Multiplier trended downward from 1.67 to 1.65, the MOVE Index remained volatile with a peak at 137.26, and Bitcoin prices surged from 82,334.52 to 105,140.38, reflecting heightened market speculation.
Forward Outlook: In the next week, the Collateral Multiplier is expected to remain stable around 1.65, while the MOVE Index may continue its volatile pattern due to ongoing macroeconomic uncertainty. Bitcoin prices could see sideways movement with potential for short-term gains. Over the next month, the Collateral Multiplier might edge lower if risk appetite diminishes, the MOVE Index could spike if bond market volatility increases, and Bitcoin may test resistance levels above 110,000. For the next quarter, the Collateral Multiplier could stabilize or decline further, the MOVE Index may remain elevated amid central bank policy shifts, and Bitcoin prices could either consolidate or break higher, depending on global liquidity conditions and investor sentiment.
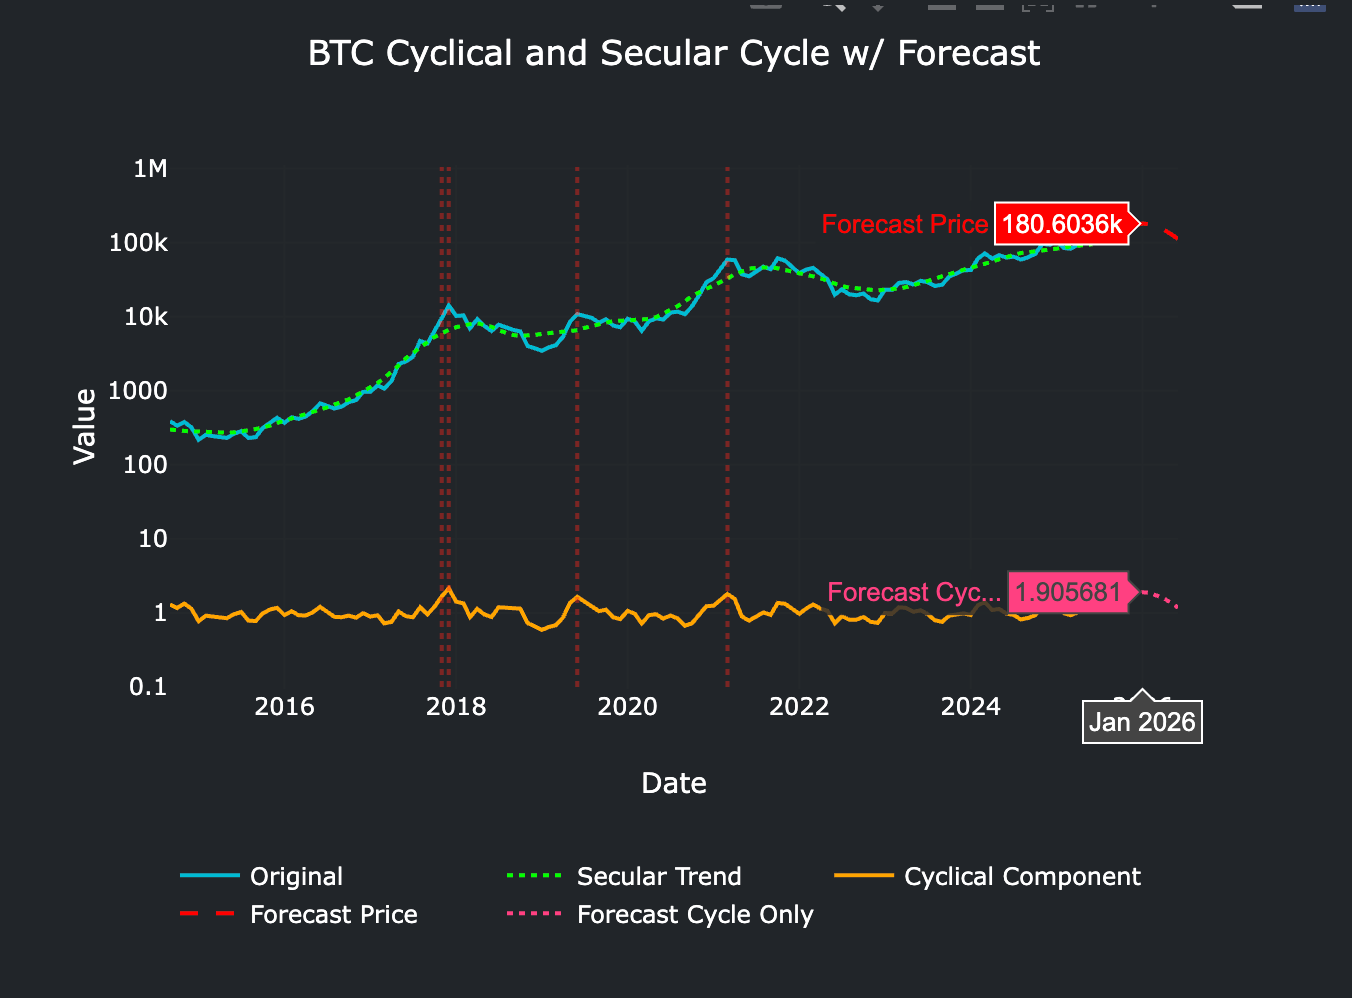
The chart illustrates Bitcoin's price movements from 2014 to 2026, distinguishing between its secular (long-term) trend and cyclical (short-term) fluctuations. The secular trend shows a consistent upward trajectory, reflecting Bitcoin's growing adoption and institutional interest, while the cyclical component highlights periodic volatility, often driven by market sentiment, regulatory news, and macroeconomic factors. The forecast predicts a peak in mid-2025 followed by a decline, suggesting a potential cyclical downturn after a period of rapid growth. This matters because it provides a framework for understanding Bitcoin's dual nature as both a long-term store of value and a high-risk, high-reward asset, offering insights for investors and policymakers.
Past Performance: Over the past week, Bitcoin's price has shown moderate volatility, aligning with its cyclical pattern. The past month has seen a slight upward trend, consistent with the secular growth line, while the last quarter exhibited stronger gains, likely driven by renewed institutional interest and favorable macroeconomic conditions. The cyclical component has remained below the 1.6 threshold, indicating relative stability compared to historical peaks.
Forward Outlook: For the next week, Bitcoin is expected to continue its current cyclical phase with minor fluctuations. Over the next month, the forecast suggests a gradual increase in price, aligning with the secular trend. The next quarter projects a more significant rise, peaking around mid-2025, followed by a potential cyclical downturn. Investors should monitor macroeconomic indicators and regulatory developments, as these could amplify or dampen the projected trends.
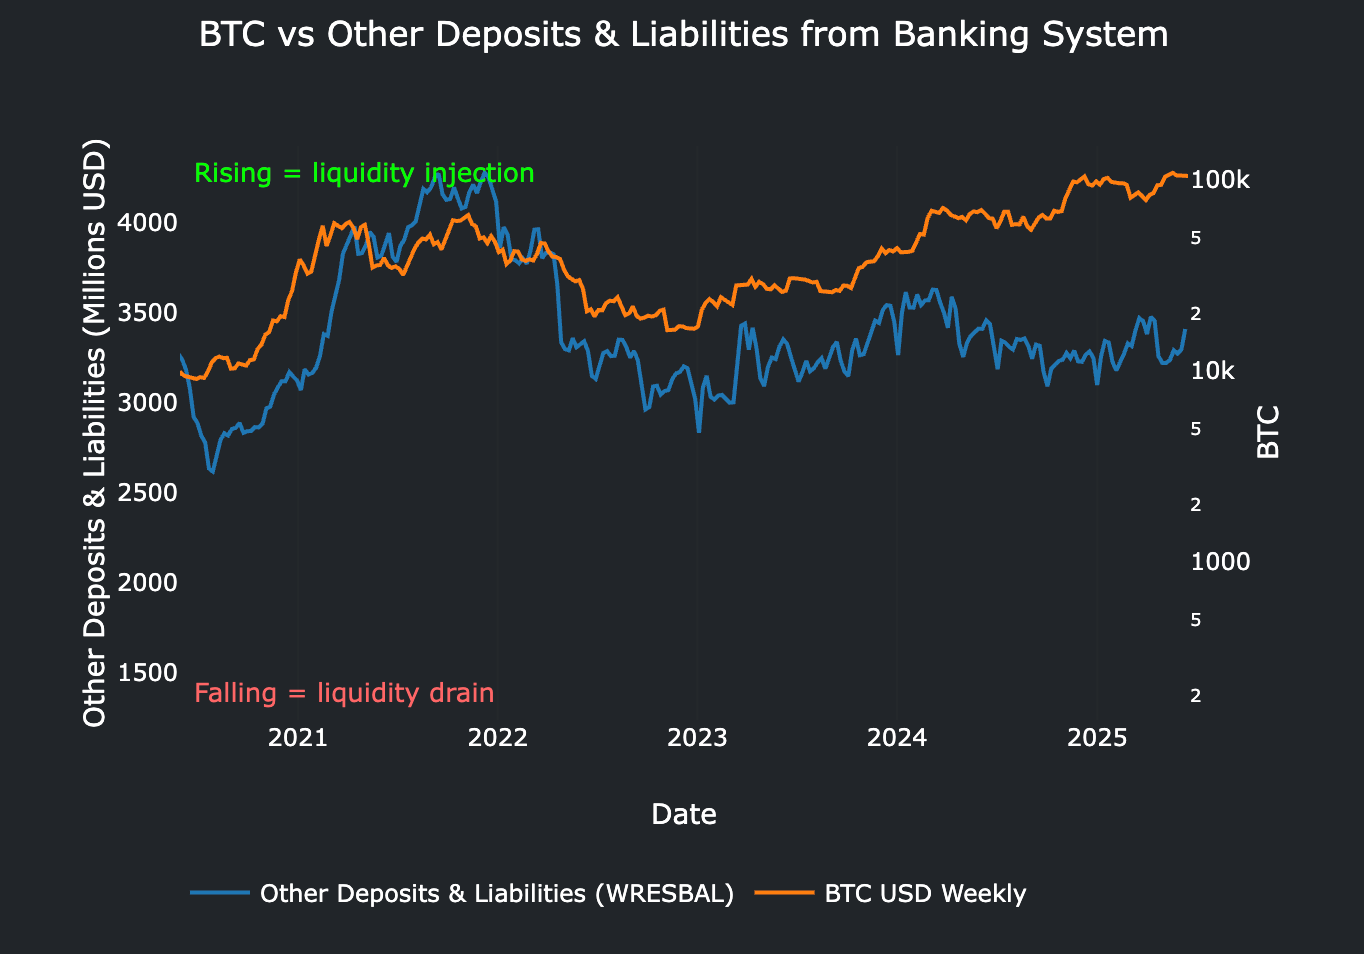
The chart illustrates the relationship between Bitcoin's price movements and the Federal Reserve's 'Other Deposits & Liabilities' (WRESBAL), which reflects liquidity injections or drains from the banking system. When WRESBAL rises, it indicates liquidity injections (QE), often correlating with risk asset rallies, including Bitcoin. Conversely, falling WRESBAL suggests liquidity drains, which can pressure asset prices. This dynamic matters because it highlights how central bank policies directly influence market liquidity and speculative assets like Bitcoin, serving as a proxy for broader financial conditions.
Past Performance: Over the past week, WRESBAL showed modest fluctuations, suggesting stable liquidity conditions. Monthly trends indicate a slight uptick, aligning with Bitcoin's resilience. Quarterly data reveals volatility, with WRESBAL peaking in early 2025, coinciding with Bitcoin's rally, followed by a pullback as liquidity tightened.
Forward Outlook: In the coming week, expect sideways movement in WRESBAL unless Fed policy shifts. Over the next month, liquidity may tighten slightly if the Fed maintains its balance sheet runoff, potentially capping Bitcoin's upside. Quarterly projections hinge on macroeconomic data; a recession could force renewed QE, boosting liquidity and Bitcoin, while persistent inflation may prolong restrictive policies.
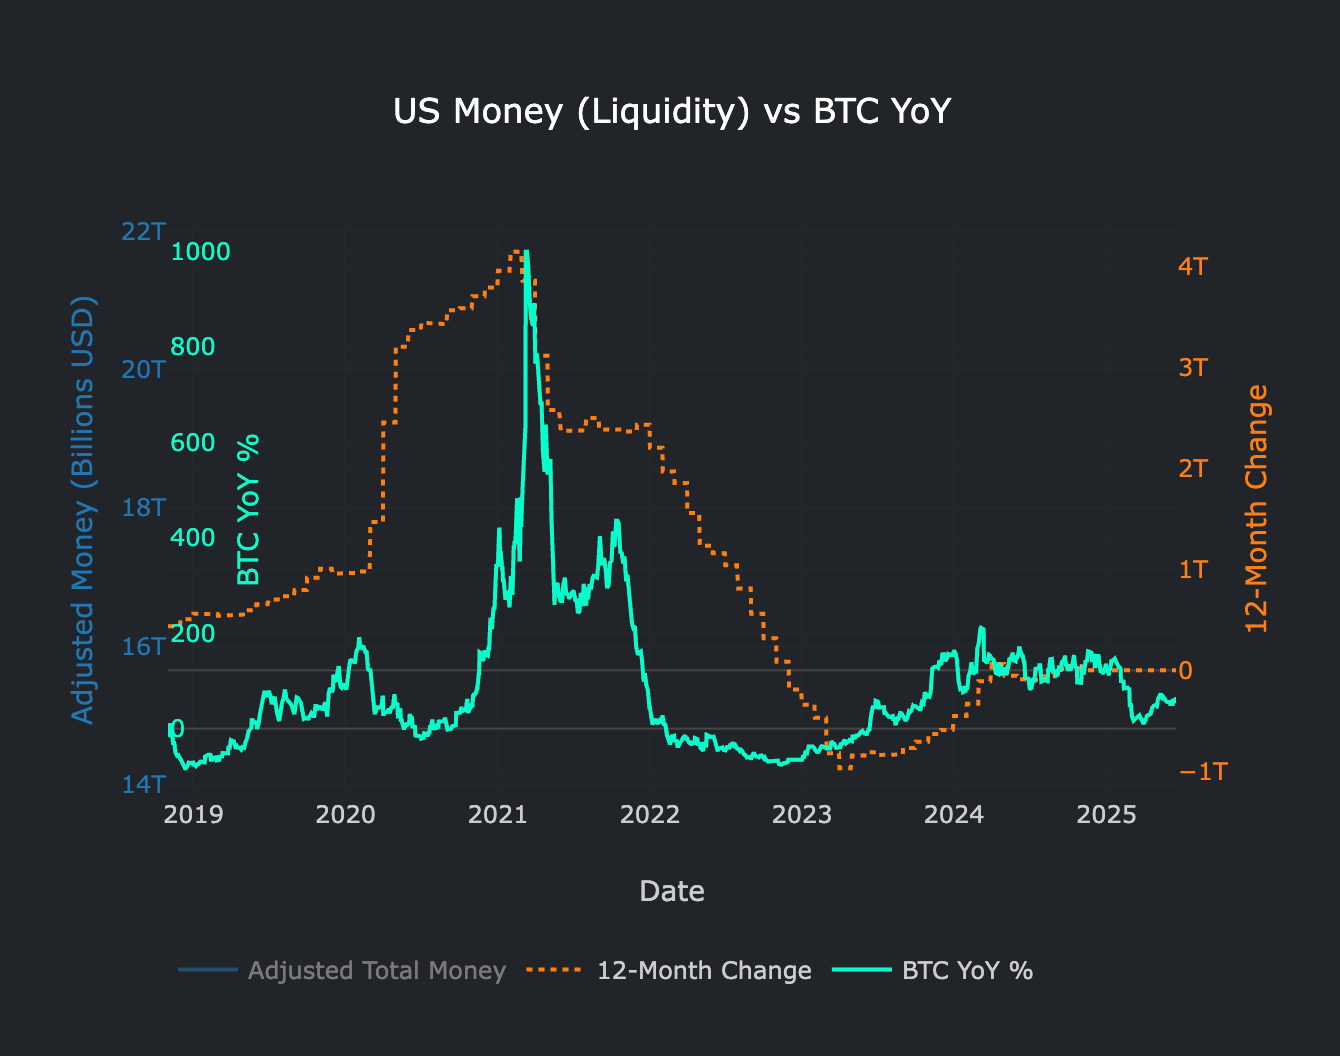
The chart titled 'US Total Money v BTC' illustrates the relationship between the adjusted total money supply in the US (measured in billions of USD) and the year-over-year (YoY) percentage change in Bitcoin (BTC) prices. It features three key data series: the adjusted total money supply, the 12-month change in money supply, and the YoY percentage change in BTC. This visualization is crucial for understanding how liquidity in the US economy correlates with the performance of Bitcoin, a leading cryptocurrency often seen as a hedge against inflation and monetary expansion. The chart highlights periods where increases in money supply coincide with or precede significant movements in BTC prices, offering insights into the interplay between macroeconomic liquidity and digital asset markets.
Past Performance: Over the past week, the adjusted total money supply has shown slight fluctuations, with the 12-month change indicating a moderate increase. BTC's YoY performance has been volatile, reflecting typical cryptocurrency market behavior. In the past month, there has been a noticeable uptick in the money supply, which may have contributed to a corresponding rise in BTC's YoY percentage. Over the last quarter, the money supply has experienced steady growth, while BTC's YoY change has seen significant swings, suggesting that BTC remains highly sensitive to broader liquidity conditions.
Forward Outlook: In the coming week, if the money supply continues its current trend, BTC may experience short-term volatility but could stabilize if liquidity conditions remain supportive. Over the next month, any significant expansion in the money supply could further bolster BTC's YoY performance, especially if investor sentiment remains positive. For the next quarter, sustained growth in liquidity might provide a tailwind for BTC, though external factors such as regulatory developments or macroeconomic shocks could introduce uncertainty. Monitoring central bank policies and global liquidity trends will be key to anticipating BTC's trajectory.

The chart illustrates the relationship between the Liquidity-Weighted Business Cycle (LWBC) and risk assets like Bitcoin (BTC), TOTAL3 (a measure of altcoin market cap), and the NASDAQ. The LWBC is segmented into expansion (green) and contraction (red) phases, with peaks and troughs marked to highlight turning points. The inclusion of BTC and TOTAL3 on logarithmic scales alongside the NASDAQ on a linear scale provides a comprehensive view of how risk assets perform across different phases of the business cycle. This matters because it helps investors understand the interplay between macroeconomic liquidity conditions and asset performance, offering insights into potential opportunities and risks.
Past Performance: Over the past week, the LWBC has shown a slight upward trend, indicating continued expansion. BTC and TOTAL3 have both seen modest gains, reflecting improved risk appetite. The NASDAQ has remained stable, suggesting resilience in tech stocks. Over the past month, the LWBC has strengthened, with BTC and TOTAL3 experiencing significant rallies, likely driven by favorable liquidity conditions. The NASDAQ has also posted gains, aligning with the broader risk-on sentiment. Over the past quarter, the LWBC has transitioned from contraction to expansion, with BTC and TOTAL3 recovering from earlier lows. The NASDAQ has outperformed, benefiting from renewed investor confidence.
Forward Outlook: For the next week, the LWBC is expected to maintain its expansionary phase, supporting further gains in BTC and TOTAL3. The NASDAQ may see sideways movement as investors await key economic data. Over the next month, the LWBC could accelerate, potentially driving BTC and TOTAL3 to new highs. The NASDAQ may also benefit, though volatility could increase. For the next quarter, the LWBC's trajectory will depend on central bank policies and global liquidity conditions. If expansion continues, BTC and TOTAL3 could sustain their upward momentum, while the NASDAQ may face headwinds from valuation concerns. A shift in the LWBC to contraction would likely pressure all risk assets.

The chart displays the relationship between the 10-Year Treasury Term Premia, Bitcoin prices (BTC$), and the 10-Year Treasury Yield over time. The Term Premia represents the additional compensation investors demand for holding longer-term bonds instead of rolling over shorter-term ones, reflecting market expectations and risk perceptions. Bitcoin, as a speculative asset, often reacts to shifts in liquidity and investor sentiment, which are influenced by Treasury yields and term premia. The 10-Year Treasury Yield is a benchmark for global borrowing costs and economic outlook. Together, these metrics provide insights into investor behavior, risk appetite, and macroeconomic conditions.
Past Performance: Over the past week, the Term Premia and 10-Year Yield have shown volatility, likely due to shifting expectations around central bank policies. Bitcoin has mirrored this volatility, reflecting its sensitivity to liquidity conditions. Over the past month, a rise in Term Premia suggests increased demand for long-term bonds, possibly due to economic uncertainty. Bitcoin's price movements have been erratic, aligning with broader market risk sentiment. Over the past quarter, the Term Premia and 10-Year Yield have trended higher, indicating tightening financial conditions, while Bitcoin has struggled to maintain upward momentum amid macroeconomic headwinds.
Forward Outlook: In the coming week, the Term Premia and 10-Year Yield may remain volatile as markets digest new economic data and central bank signals. Bitcoin could see heightened price swings in response. Over the next month, if Term Premia continues to rise, it may signal growing recession fears, potentially dampening risk assets like Bitcoin. Over the next quarter, the interplay between central bank policies and economic growth will be critical; a sustained high Term Premia could pressure Bitcoin, while a dovish pivot might revive its appeal.

The chart illustrates the relationship between Bitcoin's price, its power law baseline, and the turbulent flow (deviation from the power law) since 2017. The power law baseline represents a theoretical growth trajectory for Bitcoin, suggesting a long-term trend based on mathematical modeling. The turbulent flow captures the deviations from this baseline, highlighting periods of overvaluation or undervaluation. This matters because it provides a framework to assess whether Bitcoin's price is driven by fundamental growth or speculative bubbles, offering insights into market cycles and potential turning points.
Past Performance: Over the past week, Bitcoin's price has shown volatility, fluctuating around the power law baseline. The turbulent flow indicates minor deviations, suggesting a relatively stable period. In the past month, Bitcoin has experienced a moderate uptick, aligning closely with the power law, while the turbulent flow has remained within a neutral range. Over the last quarter, Bitcoin's price has trended upward, with the turbulent flow showing occasional spikes, reflecting short-term speculative activity.
Forward Outlook: For the next week, Bitcoin's price is expected to remain near the power law baseline, with turbulent flow likely staying subdued. Over the next month, if historical patterns hold, Bitcoin may continue its gradual ascent along the power law, with potential minor deviations. The next quarter could see increased volatility, with the turbulent flow potentially indicating a larger deviation, depending on macroeconomic conditions and market sentiment.

30-Day Correlation - BTC - Copper/Gold Ratio [Down = Bad BTC | Up = Good BTC]
BTC tracks liquidity (represents) but also represents the business cycle (sentiment) 15-22.5%


The chart titled 'BTC v Liquidity (Heatmap) Weekly' illustrates the relationship between Bitcoin's price movements and global liquidity conditions from December 2023 to September 2025. The heatmap component visualizes combined liquidity metrics, while the line graph tracks Bitcoin's price on a logarithmic scale. This correlation is significant because Bitcoin, often considered a 'risk-on' asset, tends to respond to changes in liquidity conditions, which are influenced by central bank policies and macroeconomic factors. Understanding this relationship helps investors gauge potential price movements based on liquidity trends.
Past Performance: Over the past week, Bitcoin's price showed moderate volatility, influenced by fluctuating liquidity conditions. The past month saw a gradual upward trend, aligning with periods of increased liquidity. Quarterly performance highlights a strong rally, particularly in early 2025, coinciding with sustained liquidity injections and favorable macroeconomic conditions.
Forward Outlook: In the coming week, Bitcoin may experience sideways movement as liquidity conditions remain stable. Over the next month, a potential uptick in liquidity could drive prices higher, though volatility may persist. The quarterly outlook suggests continued strength, assuming global liquidity conditions remain supportive, but risks include central bank policy shifts or macroeconomic shocks.

The chart titled 'BTC v Liquidity (Heatmap) Monthly' illustrates the relationship between Bitcoin's price movements and global liquidity conditions from January 2023 to August 2025. The upper section displays Bitcoin's price on a log scale, overlaid with liquidity signals (green for increasing liquidity, red for decreasing liquidity) shifted by 13 weeks to highlight potential lead-lag effects. The lower section is a heatmap representing combined liquidity metrics, with darker shades indicating higher liquidity levels. This visualization matters because it helps identify how macroeconomic liquidity conditions, often driven by central bank policies and capital flows, influence Bitcoin's price dynamics, a key consideration for investors in digital assets.
Past Performance: Over the past week (late June 2025), Bitcoin's price showed slight volatility amid declining liquidity signals (red bars). Monthly performance (June 2025) saw Bitcoin stabilize around $106,000 despite mixed liquidity conditions. Quarterly trends (Q2 2025) demonstrated strong upward momentum in Bitcoin's price (from ~$82,500 to ~$106,000) coinciding with improving liquidity in April-May 2025, followed by a moderation in June as liquidity conditions tightened.
Forward Outlook: For the next month (early July 2025), Bitcoin may face downward pressure due to persistent red liquidity signals. Over the next month, if liquidity conditions stabilize (as hinted by late Junes's neutral signals), Bitcoin could consolidate near current levels. The quarterly outlook (Q3 2025) remains uncertain—historical patterns suggest liquidity improvements in late Q3 could reignite bullish momentum, but further tightening may lead to corrections below $100,000.

And numerous (thousands) of other dynamic charts and AI services included within Terminal.
